

Coding for Fun vs Data Visualization
Side-by-side on feel, cost, and what your week needs to look like, so you can pick Coding for Fun or Data Visualization with your real life in mind, not just the aesthetic.
Coding for Fun and Data Visualization line up closely on feel and fit. Choose based on which activity you'd rather do on a typical weekend.
Coding for Fun
Build tools, games, and little machines out of pure logic.
Build tools, games, and little machines out of pure logic.
Data Visualization
Turn a spreadsheet into a chart that finally makes the point.
Turn a spreadsheet into a chart that finally makes the point.
Which is right for you?
Choose Coding for Fun if…
- You like the loop of tiny wins, constant errors, and making logic obey.
- Chasing a bug down to one missing colon is satisfying, not maddening.
- Building a little tool or game from nothing sounds like magic to you.
Choose Data Visualization if…
- You love the moment a messy spreadsheet collapses into one clean chart.
- Deciding what to leave out so the truth shows through appeals to you.
- You enjoy rebuilding the same plot until it actually communicates.
Experience profile93% overlap
Restful
Restful
Indoors
Indoors
Solitary
Solitary
Creative
Creative
Technical
Technical
Hands-off
Hands-off
Relaxed
Relaxed
Cautious
Cautious
Patient
Patient
Private
Private
Minimalist
Minimalist
Studious
Studious
Low-kit
Low-kit
Digital
Digital
Objects
Objects
Practical fit
Shaded rows show where they differ.
Activity type
Only Coding for Fun
Only Data Visualization
Before you commit
Coding for Fun
- An evening lost to a misplaced character would just enrage you.
- You want a finished result without the constant trial and error.
- Staring at a screen debugging alone isn't how you want to relax.
Data Visualization
- Cleaning tangled real-world data taking three times longer would grate.
- You want the chart to just work, not endless editorial second-guessing.
- Fussing over a color scale and chart type sounds like a chore.
Starter gear
What you'll need
Essential kit only, what you actually buy on day one.

Development Hardware
CanaKit Raspberry Pi 5 Essentials Starter Kit (4GB)
Online Course Subscription
Real Python Premium Annual Subscription
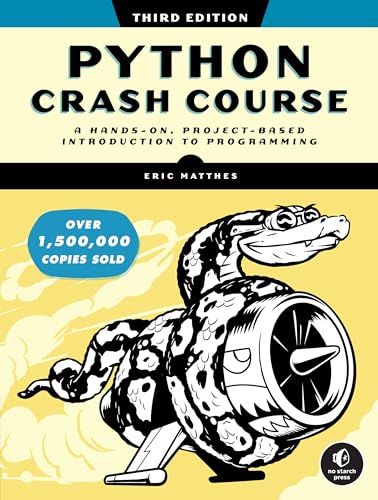
Beginner Coding Book
Python Crash Course, 3rd Edition
Data Visualization Software
Versatile Business Intelligence Platform

Programming Libraries for Visualization
Interactive Data Visualization for the Web: An Introduction to…

Data Cleaning Utilities
Data Wrangling with Python: Tips and Tools to Make Your Life Easier
Amazon affiliate links, we earn a small commission at no extra cost to you.
Common questions
Should I pick Coding for Fun or Data Visualization?
How different are Coding for Fun and Data Visualization?
Which is easier for beginners: Coding for Fun or Data Visualization?
Which costs more to start: Coding for Fun or Data Visualization?
Next steps
Still undecided?
Take the quiz: we'll match you to the right hobby.