

Data Visualization vs Robotics
Side-by-side on feel, cost, and what your week needs to look like, so you can pick Data Visualization or Robotics with your real life in mind, not just the aesthetic.
Data Visualization and Robotics can feel similar on paper, but they ask for different weeks: Data Visualization suits at home · online, Robotics suits at home. The clearest personality split is payoff: Instant for Data Visualization, Days for Robotics.
Data Visualization
Turn a spreadsheet into a chart that finally makes the point.
Turn a spreadsheet into a chart that finally makes the point.
Robotics
Build a machine and write the code that makes it move on its own.
Build a machine and write the code that makes it move on its own.
Which is right for you?
Choose Data Visualization if…
- You love the moment a messy spreadsheet collapses into one clean chart.
- Deciding what to leave out so the truth shows through appeals to you.
- You enjoy rebuilding the same plot until it actually communicates.
Choose Robotics if…
- Watching your machine finally move on its own is hard to beat.
- You like switching between soldering, mechanics, and chasing code bugs.
- You'll debug a twitching motor for hours to get it right.
Experience profile83% overlap
Still
Still
Deep focus
Intense
Optional group
Optional group
Rule-based
Structured
Instant
Days
Open-ended
Open-ended
Depth & mastery
Data Visualization
Progression · Gradual mastery
Robotics
Progression · Lifelong craft
Practical fit
Shaded rows show where they differ.
Activity type
Both
Only Data Visualization
Only Robotics
Sensory & flags
Data Visualization only
Robotics only
Before you commit
Data Visualization
- Cleaning tangled real-world data taking three times longer would grate.
- You want the chart to just work, not endless editorial second-guessing.
- Fussing over a color scale and chart type sounds like a chore.
Robotics
- Wiring shorts and code errors before anything works would defeat you.
- Broken parts and rising budgets would stall you fast.
- You want linear progress, not a long stretch of nothing moving.
Starter gear
What you'll need
Essential kit only, what you actually buy on day one.


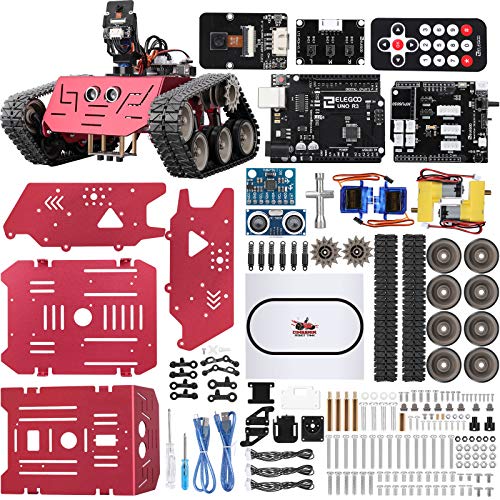

Amazon affiliate links, we earn a small commission at no extra cost to you.
Common questions
Should I pick Data Visualization or Robotics?
How different are Data Visualization and Robotics?
Which is easier for beginners: Data Visualization or Robotics?
Which costs more to start: Data Visualization or Robotics?
Next steps
Still undecided?
Take the quiz: we'll match you to the right hobby, solo or with friends.